Weather observations
The Agromet.be platform aims to disseminate, in real time, the weather data recorded at the 36 stations of the CRA-W’s Pameseb network.
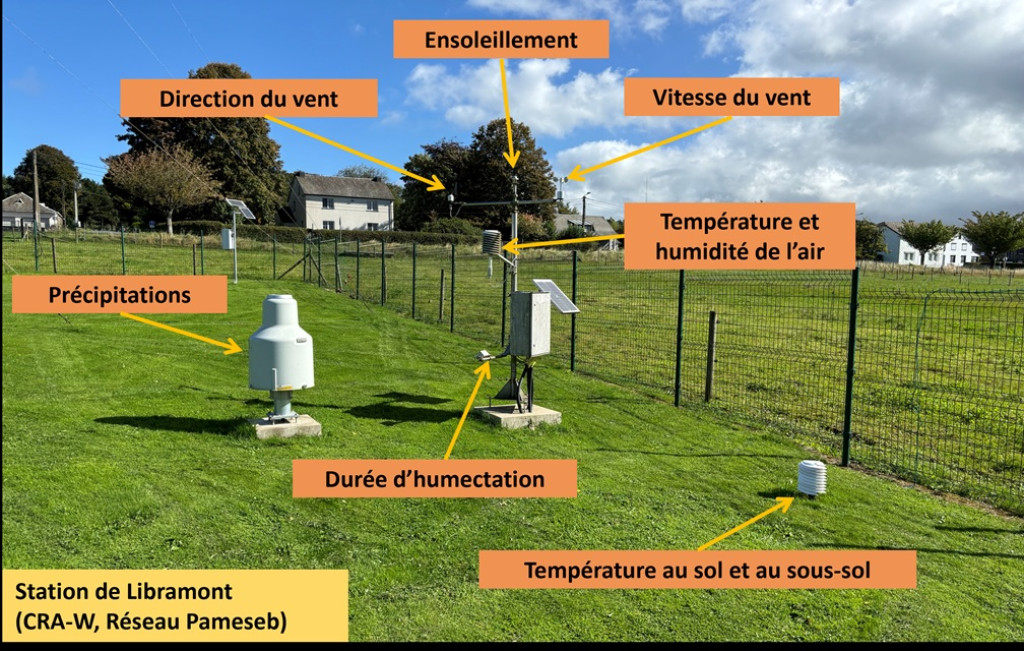
These stations measure, at an hourly time step, air temperature and humidity, precipitation, temperature at the soil surface and at -5, -10, -20 and -50 cm below ground, wind speed and direction, sunshine duration and leaf wetness. The recorded data are automatically sent to a central system, where they are validated and made available to various decision support systems, whether specific to Agromet.be or hosted by external partners.
Weather data systematically undergo a daily quality control based on automatic procedures supervised by a human operator. Erroneous data (due to missing values or a faulty sensor) are corrected.
The data can be downloaded manually or queried via the Agromet APIs.
This network has been active since 1997.
Spatialized weather data
The platform also provides spatialized weather data, i.e. data derived from a spatial interpolation between Pameseb stations. The data are available for air temperature and humidity at hourly and daily time steps. Maps with a resolution of 1 km² can be viewed online.
Decision support tools
The Agromet.be platform offers free-access agrometeorological decision support tools to help farmers monitor their crops. These tools are fed in real time with weather data (observations and/or weather forecasts).
The tools currently available are:
- Wheat DST (“OAD Froment”) – Calculation of the phenological development of winter wheat crops. Guidance towards the optimal fungicide programme to control the 4 main wheat diseases. Calculation of the emergence dates of the orange wheat blossom midge.
- Sugar beet DST (“OAD Betterave”) – Calculation of the crop’s development stage and of weather-related risks of Cercospora leaf spot.
- SprayVision – Identification of optimal spraying windows for the next three days.
- DegreeDays (“DegréesJours”) – Calculation of customized degree-day sums. The user selects the base temperature and the optimal temperature for the living organism whose development they want to simulate.
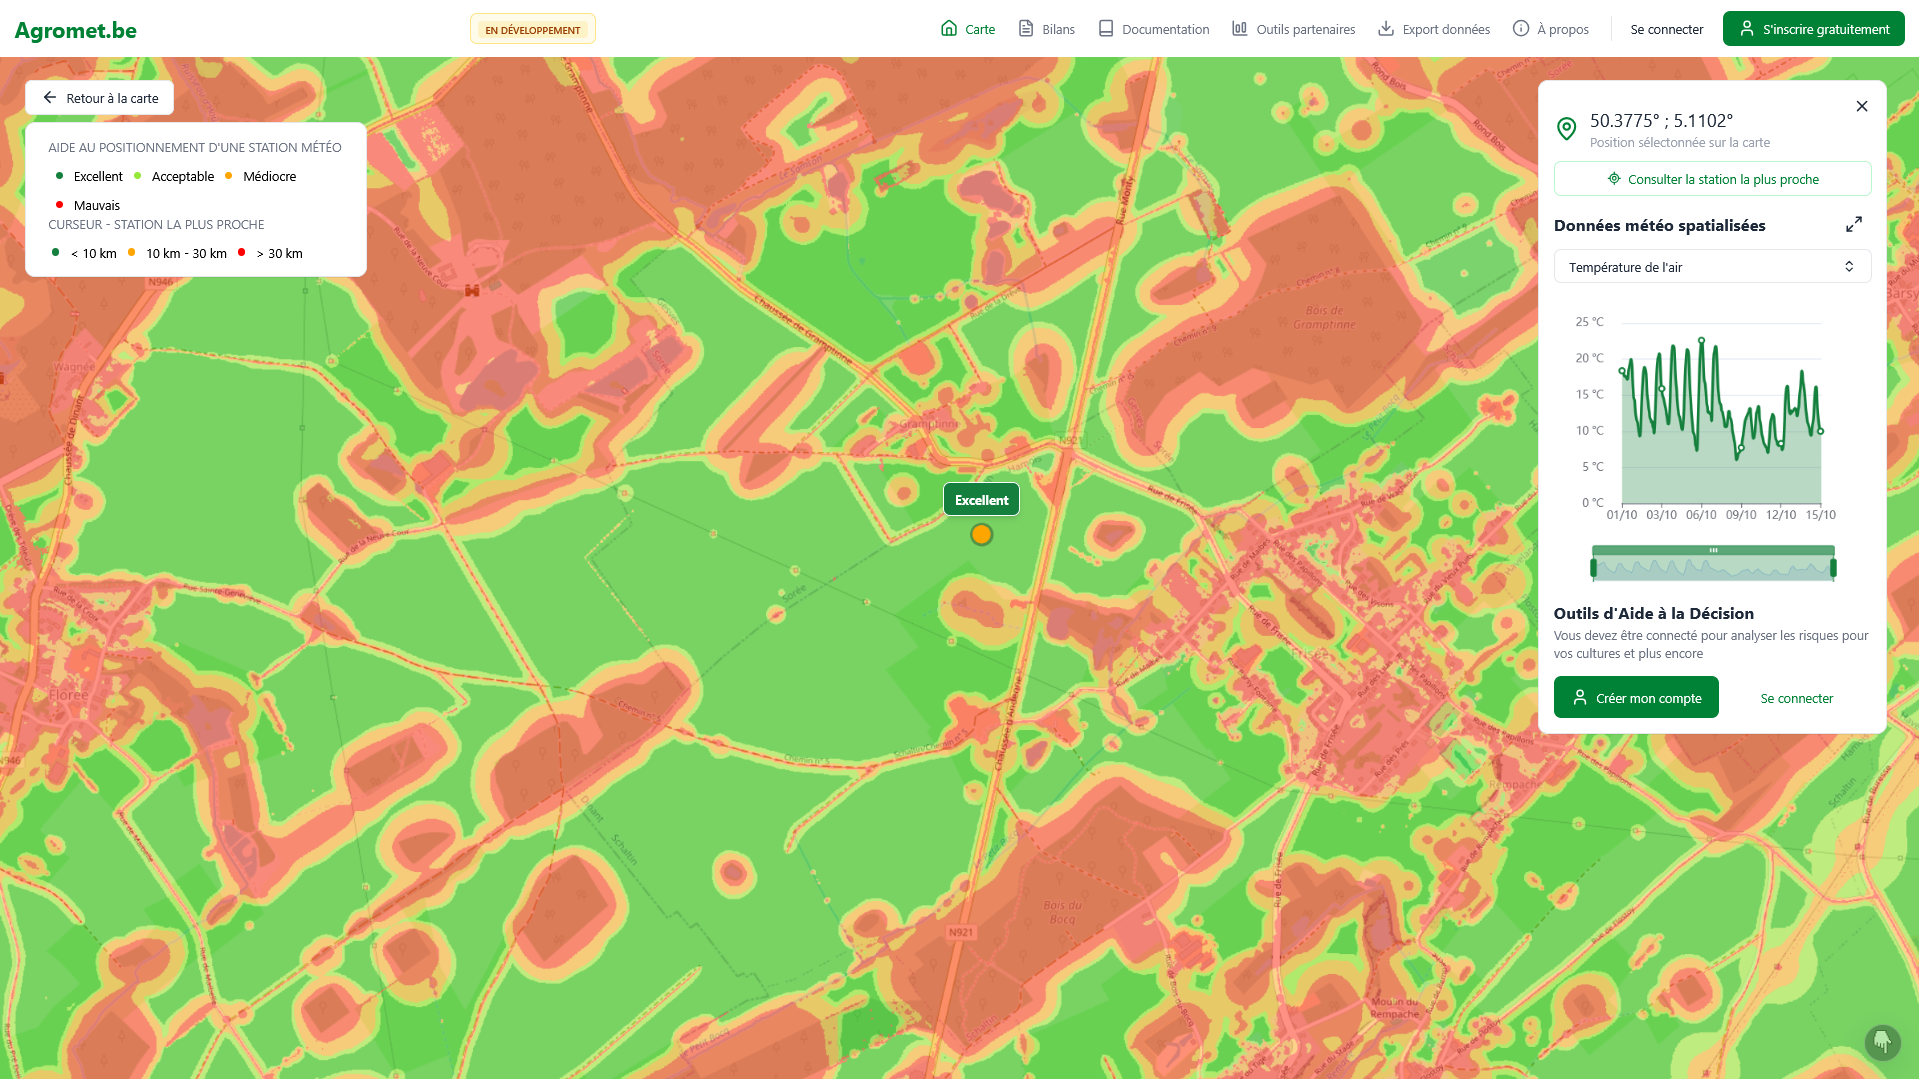
- Commercial weather station siting aid – A siting aid layer maps, across the whole of Wallonia, the quality of locations for a weather station according to four classes ranging from “Poor” to “Excellent” (see illustration below).
A monthly bioclimatic report
Each month, a bioclimatic report based on the Pameseb network stations provides agrometeorological indicators in the form of maps or graphs, in order to put the conditions of the past month into perspective and analyse their impact on crops, livestock or forests. This report is produced in collaboration with the OWSF (Walloon Forest Health Observatory).
These reports are accessible from the Agromet.be platform. It is also possible to subscribe to the mailing list to receive them by email at the beginning of each month by sending an email to agromet@cra.wallonie.be.
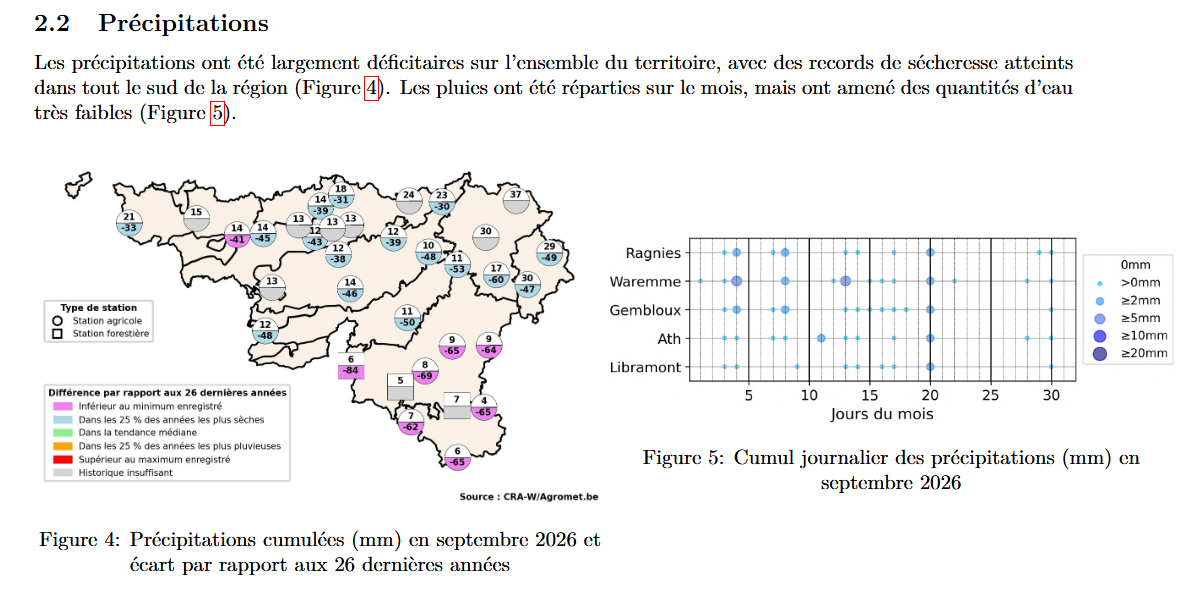
Excerpt from the September 2026 bioclimatic report.
How to access it?
The weather data and the tools are accessible from the Agromet.be platform.

Screenshot of the Agromet.be platform.
Partenership
IRM, WALLeSmart
Funding
Dotation


Useful information
Team