The INVITE project aims to promote the introduction of new varieties resistant to biotic and abiotic stresses, adapted to sustainable management practices and exhibiting good resource use efficiency, due to the improvement of variety assessment tools and a better information to farmers on the performance of varieties under various production conditions. This has been illustrated on the main cultivated species which cover different modes of propagation, various uses in food and animal feed and which show a significant breeding activity in the EU.
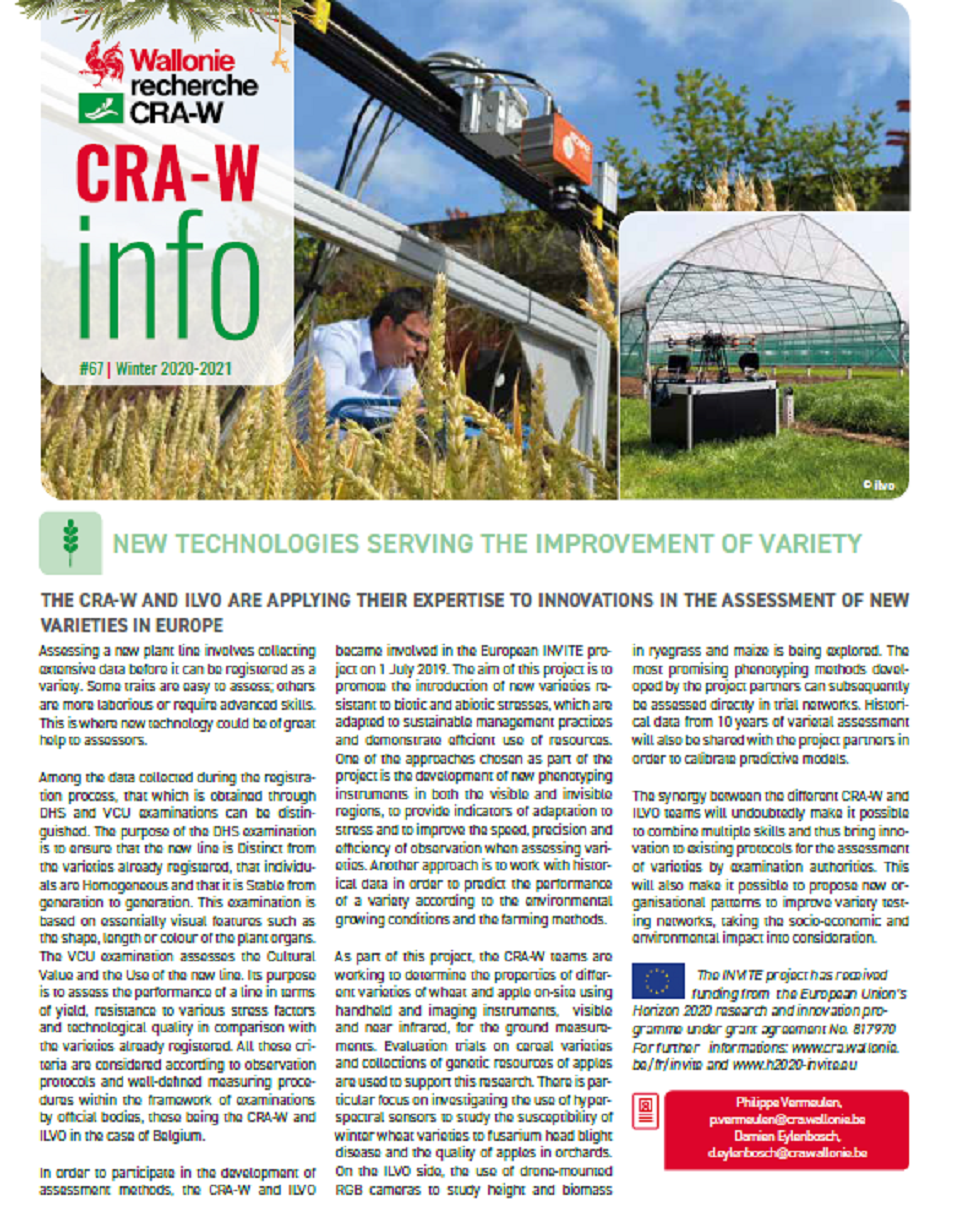
The CRA-W was involved on different operational objectives. One of the objectives was the development of new phenotyping tools in both the visible and non visible regions, to provide indicators of adaptation to stress and to improve the speed, precision and efficiency of observations when assessing varieties. To achieve this goal, the CRA-W teams have worked to determine on-site the properties of different varieties of wheat and apple using handheld and imaging instruments, visible and near infrared, for ground measurements. The evaluation trials on cereal varieties as well as the collections of apple genetic resources were used as support for this research. In particular, various optical sensors were evaluated to study the quality of apples in orchards, to measure the length of organs (stem, internodes, ear) of wheat plants, to count the number of orange blossom midge larvae extracted from wheat ears, to evaluate the susceptibility to fusarium head blight disease of winter wheat varieties in the laboratory and in the field, as shown in the following figures. Another goal was to work on historical data to predict the performance of a variety depending on environmental growing conditions and farming practices.

Figure 1 : Acquisition of spectral data on apples using a laboratory spectrometer or a portable spectrometer and calibration results for 4 quality parameters: dry matter, brix, acidity and total polyphenols.

Figure 2: Measuring the length of organs (stem, internodes, ear) of wheat plants from RGB images.

Figure 3: Counting of cecidomyia larvae, extracted from wheat ears, from RGB images

Figure 4: Acquisition and processing of hyperspectral images of wheat ears in the laboratory in order to assess the % of Fusarium contamination per ear.

Figure 5: Acquisition and processing of hyperspectral images of wheat ears in the field in order to assess the % of Fusarium contamination per plot.
Project presentation video: https://www.youtube.com/watch?v=7kJAMEXTWeM
Final conferences:
28th Nov 2024:
https://www.h2020innovar.eu/innovar-invite-final-conference-part-1-innovations-in-wheat/
10th Dec 2024:
https://www.h2020-invite.eu/invite-final-conference-a-milestone-for-the-future-of-plant-variety-testing-in-europe/
The INVITE project has received funding from the European Union’s Horizon 2020 research and innovation programme under grant agreement No. 817970.
Publications
Vermeulen, P. (2024). Apport de la spectroscopie et de l'imagerie pour le phénotypage des productions végétales: Activités de phénotypage au CRA-W. Lecture in: L'apport de la spectroscopie et de l'imagerie pour le phénotypage des productions végétales, Gembloux Agro-Bio Tech Université de Liège, 10 Septembre 2024.
Dandrifosse, S. , Jacquemin, G. , Henriet, F. , Gruntowy, J. , Maigniel, J-P. , Cadot, V. & Vermeulen, P. (2024). Counting the number of orange wheat blossom midge (OWBM) larvae on wheat ears using RGB images. Poster in: Final Innovar/Invite conference, Bruxelles, Belgium, 10 December 2024.
Vincke, D. (2024). Evaluation of fusarium head blight infection on winter wheat using near infrared hyperspectral imaging from the laboratory to the field. Gembloux, Belgique, ULiège. GxABT - Liège Université. Gembloux Agro-Bio Tech, Gembloux, Belgique, 155.
Vincke, D. , Eylenbosch, D. , Treier, S. , Mascher, N. , Herrera, J. , Cadot, V. & Vermeulen, P. (2024). Phenomics – Study case : Detection of fusarium head blight (FHB) on wheat. Poster in: Final Invite conference, Bruxelles, Belgium, 10 December 2024.
Vermeulen, P. (2024). Phenomics Study case: FHB detection in wheat. Lecture in: Final Innovar/Invite conference, Bruxelles, Belgium, 28 November 2024.
Vermeulen, P. , Cadot, V. & Herrera, J. (2024). Plant Health: Validated sensors and methodology applicable for biotic stresses in wheat. Lecture in: PHENET Webinar: biotic interaction in agroecosystems, Online, 29 November 2024.
Vermeulen, P. , Henriet, F. , Jacquemin, G. , Dandrifosse, S. , Rousseau, D. , Garbouge, H. & Cadot, V. (2024). Use of RGB image analysis in the lab and different tools developed to detect fusarium head blight symptoms in wheat in the lab and in the field. Lecture in: Phenotyping workshop, 30 September 2024.
Vermeulen, P. , Cadot, V. , Terzi, V. & Treier, S. (2022). Sélection variétale : les nouveaux outils du phénotypage Phytoma 751,
Vincke, D. , Mercatoris, B. , Eylenbosch, D. , Baeten, V. & Vermeulen, P. (2021). Assessment of kernel presence in winter wheat ears using Near-Infrared Hyperspectral Imaging. Poster in: ICNIRS, Beijing China, 18-21 October 2021.
Vincke, D. (2021). Développement d'outils de spectroscopie et d'imagerie pour le phénotypage des cultures. Lecture in: HélioSPIR, 29 juin 2021.
Godechal, F. (2021). Etablissement d'un protocole d'acquisition par rotation d'images pour le suivi du développement d'épis de froment d'hiver et la proxidétection de la fusariose au champ. Gembloux, Gembloux Agro-Bio Tech ULG, Travail de fin d'études, 68.
Pissard, A. , Nascimento Marques, E.J. , Dardenne, P. , Lateur, M. , Pasquini, C. , Pimentel, M.F. , Fernandez, J.A. & Baeten, V. (2021). Evaluation of a handheld ultra-compact NIR spectrometer for rapid and non-destructive determination of apple fruit quality. Postharvest Biology and Technology, 172: (111375), 1-10.
Vincke, D. , Eylenbosch, D. , Jacquemin, G. , Baeten, V. , Mercatoris, B. & Vermeulen, P. (2020). Estimation de l'intensité d'infection de Fusarium graminearum sur épis de blé tendre par imagerie hyperspectrale proche infrarouge (NIR-HSI). Proceedings in: Phloème 2020 biennale de l'innovation céréalière, Cité des Sciences et de l'Industrie à Paris, France,