Context
The SAGRIWASENT project falls within the framework of the Common Agricultural Policy (CAP) and the annual subsidies paid to farmers in accordance with European legislation in this area, taking into account the evolution of new technologies available.
In view of the implementation of the COPERNICUS program, the new technologies available and the evolution of European regulations towards "Monitoring", the project is currently responding to a request from the SPW for technical assistance requiring applied research related to the implementation of "Monitoring" in the framework of the new CAP.
COPERNICUS program and new technologies
High temporal and high spatial resolution Remote Sensing (RS) imagery constitutes a major asset for crop monitoring. As part of the upcoming reform of the Common Agricultural Policy (CAP) in 2020, the Sentinel-1 and Sentinel-2 satellites from the COPERNICUS program will play an increasing to this aim.
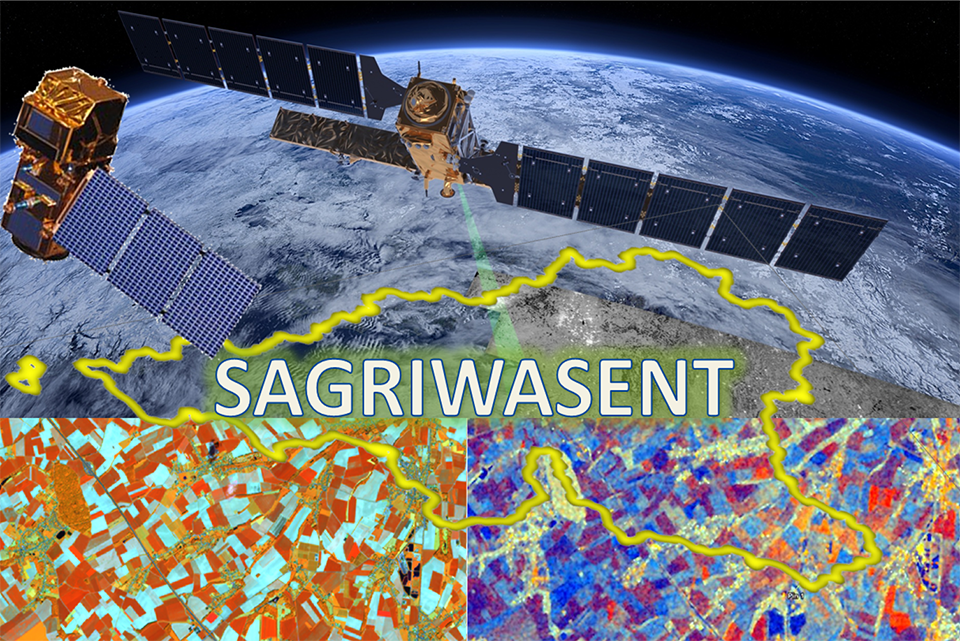
Indeed, earth observation by remote sensing from space has made spectacular progress with the European program COPERNICUS, which includes the launch of a series of 6 different types of satellites. Among them, the satellites offer both cloud insensitive RADAR data (Sentinel-1) and multi-spectral optical data (Sentinel-2), with high spatial resolution (between 10 and 60 m) and a revisit period of 2 to 5 days in Wallonia. The information contained in these images is highly relevant for the monitoring of agriculture, the spatial resolution allowing a good detection of agricultural plots and the temporal resolution offering the possibility to monitor the evolution of different crops with variable annual cropping calendars. Other technologies, such as UAVs and geotagged photos, also make it possible to provide administrative services with relevant information for monitoring agricultural activities carried out on their territory.
Common Agricultural Policy evolution
In 2018, the European Commission (EC) provided a legal and technical framework to exploit the advantages of Copernicus satellite data in the context of CAP controls. This new reform has an impact also on the checks carried out by the Member States in order to confirm the eligibility criteria of the aid or support requested by the farmers. The actual on-the-spot-checks (OTSC) control system, i.e. a sample approach practice performed yearly by the EU Member states on at least 5% of aid applications, has to be replaced by the Check by Monitoring (CbM). CbM introduces a monitoring and prevention system that mainly relies on continuous provision of Sentinel satellite data. This is a procedure of regular and systematic observation, tracking and assessment of all eligibility criteria, commitments and other obligations which can be monitored by Copernicus Sentinels satellite data or other data, over a period of time that allows to conclude on the eligibility of the aid or support requested.
Objectives
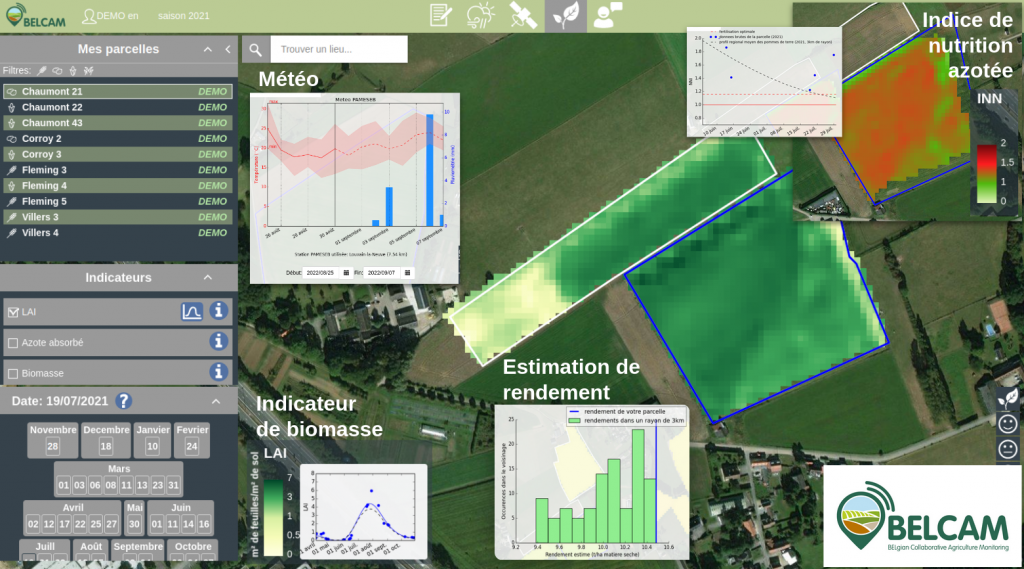
The initial objective of the SAGRIWASENT project is to simplify and automate as much as possible the administrative procedures of farmers and the Walloon Paying Agency related to the management of PAC declarations and the LPIS system, thanks to an optimal exploitation of the remote sensing information available in Wallonia.
The use of the most relevant satellite images makes it possible, thanks to the use of images acquired in different wavelengths and different temporal and spatial resolutions, to manage/modify in the most automatic way possible the information relating to the Walloon parcel.
In view of the evolution of European regulations towards "Monitoring", the project's applied research has been adapted and can be broken down into several points listed below.
Scientific objectives :
Change detection in parcel delineation
This objective aims to identify, thanks to Sentinel images, parcels within which the land use is not homogeneous and therefore probably presents a difference with respect to the last declaration received. For each of these identified parcels, alerts are provided to farmers and administrative services to warn them to pay particular attention to these parcels when drawing them again. These are alerts of potential land changes available throughout the year. In particular, the results will help farmers with their online declaration (by showing spots with possible changes).
Detection of ineligible areas
An operational and automated method using Sentinel-2 (S2) images is developed for detecting new non-eligible areas (buildings, infrastructure, ...) inside agricultural.
Crop Identification
This objective aims to classify the crops in the crop groups considered for CAP greening (more than 50 groups), based on Sentinel images.
Monitoring of agricultural land use on key dates
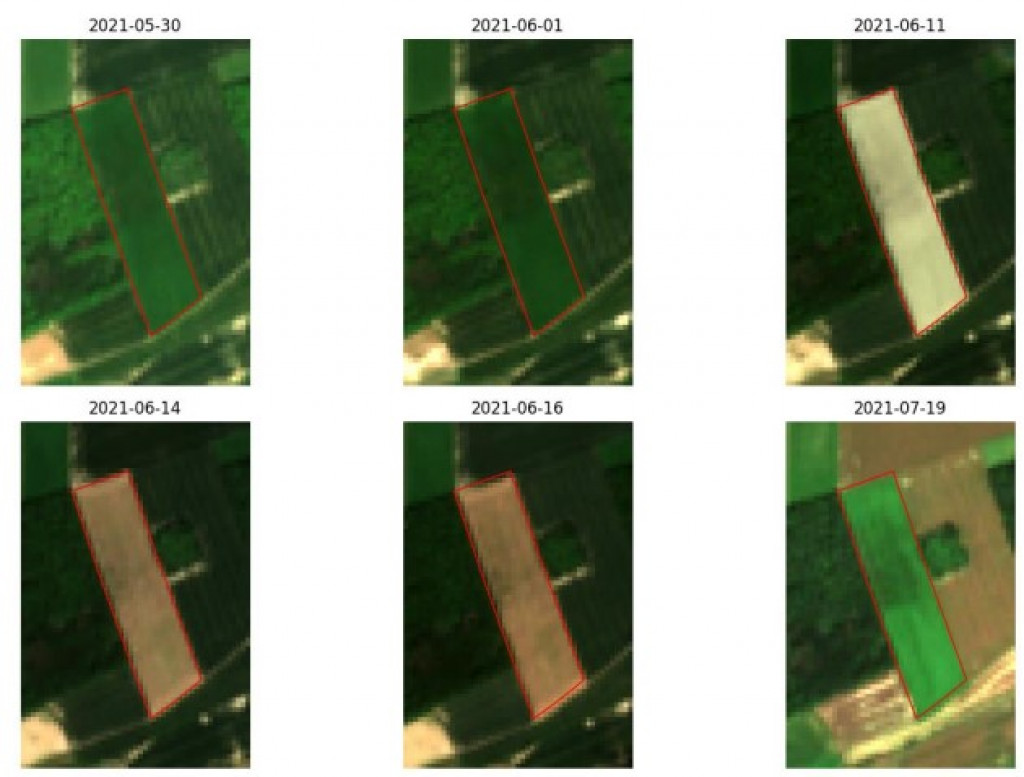
This objective makes it possible to verify changes at key dates in order to detect mowing, harvesting, ploughing or other agricultural practices.
Results
Change detection in parcel delineation
The results of SAGRIWASENT allow to visualize the plots whose last declared boundaries do not/no longer correspond to the reality of the terrain. This result gives to farmers very recent images of their plots that have been modified compared to the previous year so that they can better target them and draw them during their declaration (directly on PAConWEB).
A major scientific innovation is the synergic use of both NDVI images (S2) and SAR coherence products (S1), a method never before applied. The advantage of SAR images is that they are available regardless of weather conditions (insensitive to the presence of clouds).
Crop Identification
The proposed algorithm is able to identify different crops from multi-temporal Sentinel-1 data for a large area of about 765 thousand agricultural hectares in the Walloon Region (WR), South part of Belgium, with high performance. It leads to 94.5 % of well-classified area using 8 months season (January-August) Sentinel-1 time series, and it discriminates 26 crop groups. F1-scores are the highest for the most represented crop groups, always higher than or equal to 0.87 for the 6 most represented groups.
Monitoring of agricultural land use on key dates
Crop harvest and ploughing are detected from Setinel-2 NDVI time series for each plot and its neighbours.
Schedule
- WP 1 (3 months): Analysis of the agriculture European regulation and understanding of its implementation in Wallonia
- WP 2 (3 months): Bibliographic and technical research on the use and integration of satellite images to monitor agriculture
- WP 3 (6 months): Technical research on how to automate the integration of satellite data and perform functional analysis
- WP 4 (14 months): Operational implementation of geospatial data integration for agriculture monitoring and technical research on how to integrate inter-annual changes in the most automatic way possible and to perform functional analysis.
- WP 6 (12 months): Validation of the data adequacy between reference data and geospatial observations
- WP 7 (2 months): writing of technical papers and final reports